


Note: This was a project for a STAT class at Purdue University that was turned into an article.
Overview:
The National Basketball Associate (NBA) is widely considered the highest form of basketball played in the world [1]. The league, consisting of 30 teams across the United States and Canada, only takes in the best premier talent from college and Euro Leagues to create a player pool of around 450 first-rate players that can create an actual impact in an NBA game [2].
However, even in a league as highly competitive talent-wise as the NBA, each player has still developed their own specific skillset. The NBA does not require players to be extremely skilled at every portion of the game. Rather, players have strength that they hone so they can most easily help impact the flow and outcome of a game. This has allowed some players to be defined by these skills, such as Steph Curry’s shooting, Shaquille O’Neal’s rebounding, and Chris Paul’s passing [3]. When constructing an NBA team, general managers focus on what makes a player special and if those specific skills can influence a team in areas they are lacking in.
One example of this is the Golden State Warriors trade for Miami Heat All Star Jimmy Butler. Throughout the beginning of the 2024-2025 season, Jimmy Butler was extremely upset with the coaching staff on the Miami Heat, and both sides were publicly considering parting ways with each other. As for the Warriors, they had started the season with a 25-26 record and wanted to make a move to pair their aging Superstar in Stephen Curry with another Allstar to try and win one more championship before he retires. Jimmy Butler and the Warriors were closely linked to each other throughout the season, and the trade was finally made, sending Jimmy Butler to the Warriors [4]. In this paper, we will try and determine if Jimmy Butler unique skillset properly transferred over and impacted the Golden State Warriors.
As one reporter claims, Jimmy Butler is
“an extremely well-rounded player who attacks the glass with ferocity, defends at a high level, and can make the game easier for others as a playmaker” [5].
We will be analyzing each part of this statement, as well as trying to predict how many of Jimmy Butler’s tangible statistics can contribute to the offense of the Golden State Warriors.
Dataset/Exploration
The data that we will be using to determine the effect Jimmy Butler had on the 2024-2025 Golden State Warriors will be from a website called Basketball Reference. Basketball Reference is a free to use website that keeps track of both NBA and WNBA data. This includes both team data, such as for the Golden State Warriors [6] ,and player data, such as for Jimmy Butler [7] for any season dating back to the 1946-1947 season. These tables can be downloaded as CSV files, or taken directly from the webpage itself, which is what we will be doing.
As for the specific datasets, we will be using Jimmy Butler’s and the Golden State Warriors’ 2024-2025 game logs. These tables represent the tangible statistics that Butler/The Warriors put up in their games of the 2024-2025 season. Both tables have over 30 different variables that are recorded for each game. The easiest variables to visualize for us will be the tangible variables that happen in a game, such as points, rebounds, assists, steals, and blocks.
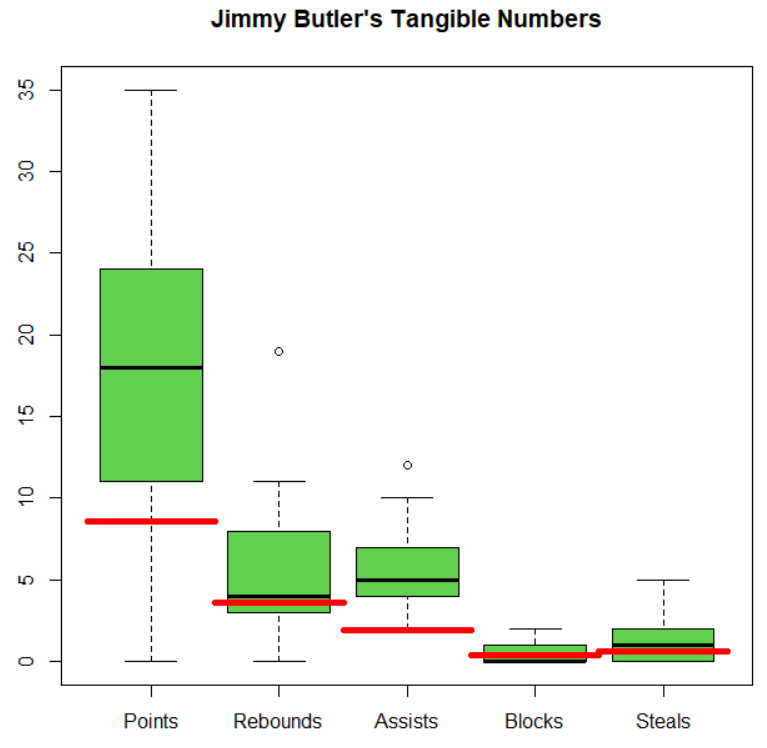
These variables are often the most talked about when covering a player’s performance. We can use these variables to get a basic understanding of Jimmy Butler’s performance across the season. The red lines represent league averages from the 2020-2021 season [8]. While the 2020-2021 season might have slightly different averages, and Jimmy Butler played around 10 more minutes a game than the average player [7], we can use this graph to get a basic understanding of how much Butler contributes compared to the average player across the league. This graph shows that Butler excels more in scoring and playmaking than the average player, and highlights some of the points that we noted earlier at first glance. We can also see that scoring can be extremely varied per game, which can be attributed to the fact that NBA defenses and player roles can vary from game to game to try and adapt to the team that they are facing. As for Jimmy Butler, he had a game against the Oklahoma City Thunder where he did not score a single point (although he did not play much) as well as a game where he scored 35 points against the Detroit Pistons [7].
Similarly, we can do this for the Golden State Warriors and highlight their important results compared to the rest of the league in 2024-2025 [9], such as points scored, points allowed, rebounds, assists, steals, and blocks.
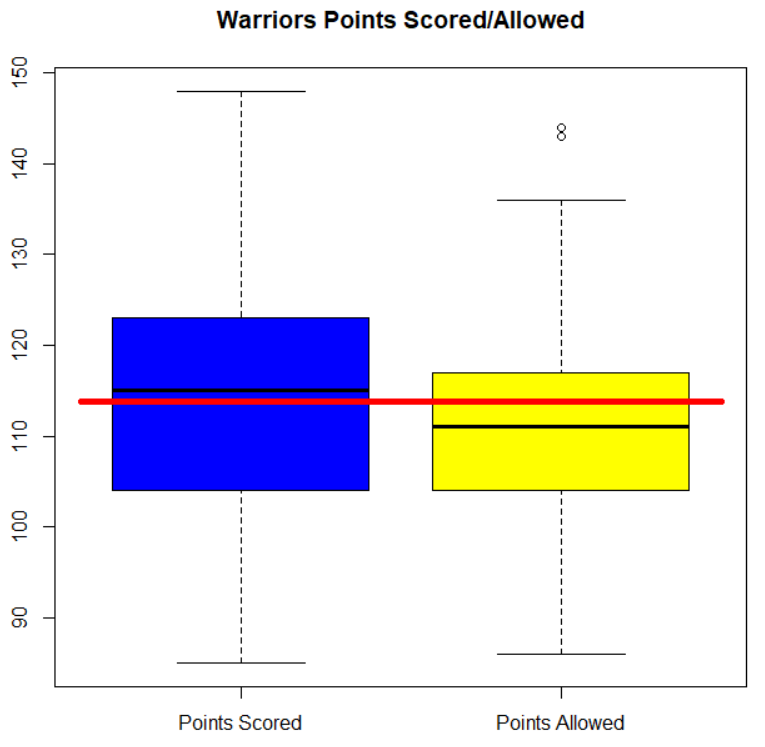
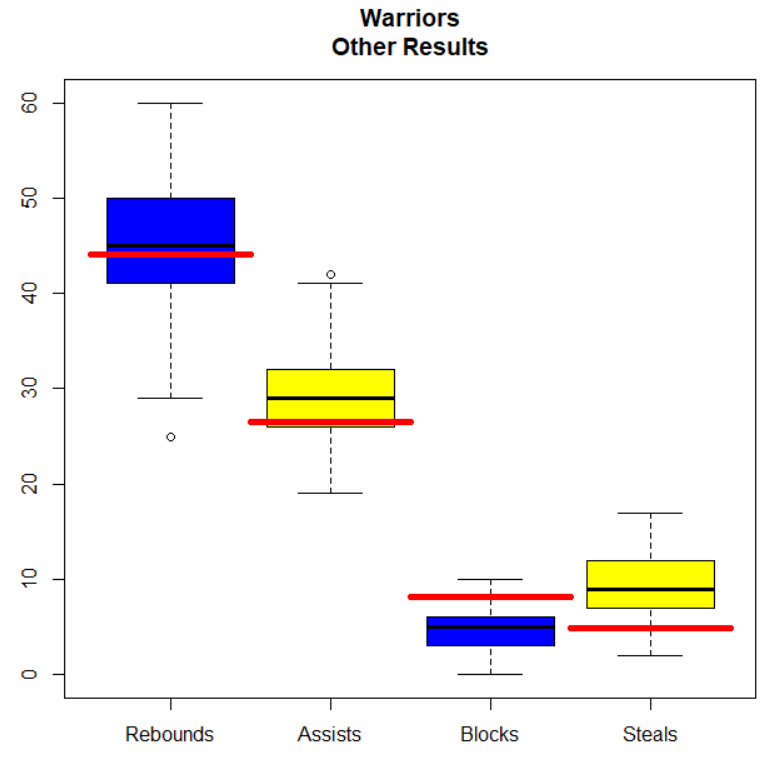
This data shows that the Warriors were slightly above average in scoring and defense. It also shows that the Warriors were better at scoring assists and getting steals than the average NBA team, but below average in blocks, which can be attributed to their second to last average team height [10]. An important thing to note is that this data for both Butler and the Warriors is for the entire season, however, Butler joined the Warriors for game 52 and onwards of the season.
The simplest way to see a player’s impact on a team is to compare the winning percentage before and after the player joins the team.
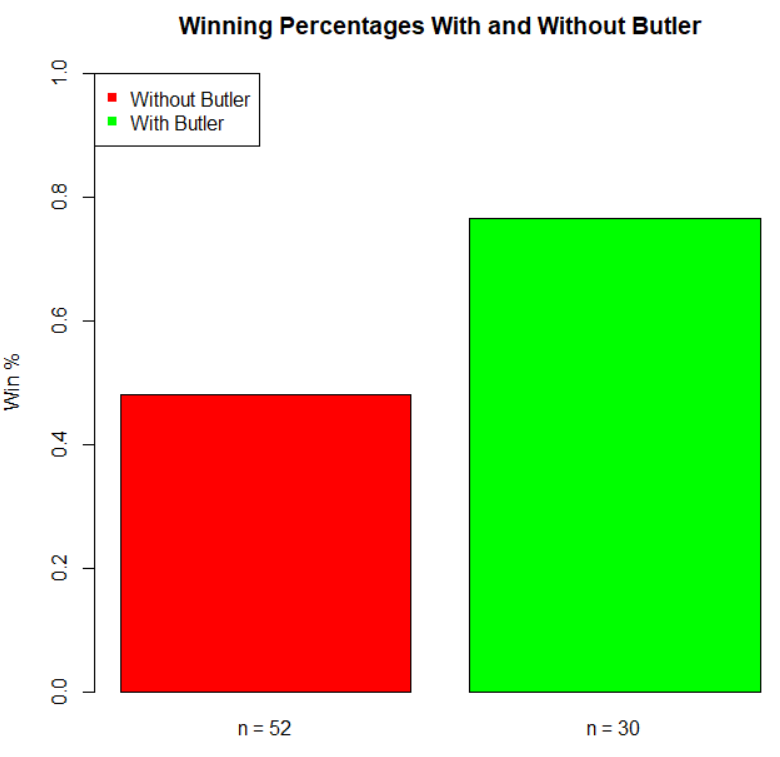
At a glance, we can see that the Warriors’ winning percentage went up after Jimmy Butler joined the team, and running a proportion test with a null hypothesis that the two percentages are equal, and an alternative hypothesis that the percentage is greater after Jimmy Butler joins the team, we get a p-value of 0.01077, showing a significant chance that the two proportions cannot be equal, and that Butler contributed to an increase in the winning percentage of the Warriors.
Data Analysis
Now that we understand the data, we can now try and determine some of the effects Jimmy Butler brings to the Warriors other than their winning percentage.
"Attacks the Glass with Ferocity"
Jimmy Butler is very well known for relying on his strength to attack the inside of the defense to try and get a shot closer to the basket [11]. While the main goal of these attacks is to try and get an easy layup (shooting close to the basketball rim), an added bonus for any team that Butler plays on is the ability to attempt more free throws. Butler tends to get fouled quite often when attacking the rim, as his quick speed and footwork causes the defending players to overreach and foul him. This not only allows him to shoot free throws often, but by causing the other team to commit more fouls, eventually his team will get into the ‘Bonus’ where they will be able to shoot free throws more often. Thus, we should be able to see a significant difference in the number of free throws attempted by the Warriors before and after Butler joins the team:
H_0 - the average amount of FTA when Butler plays and doesn’t play is equal
H_A - the average amount of FTA when Butler plays are greater than we he does not play
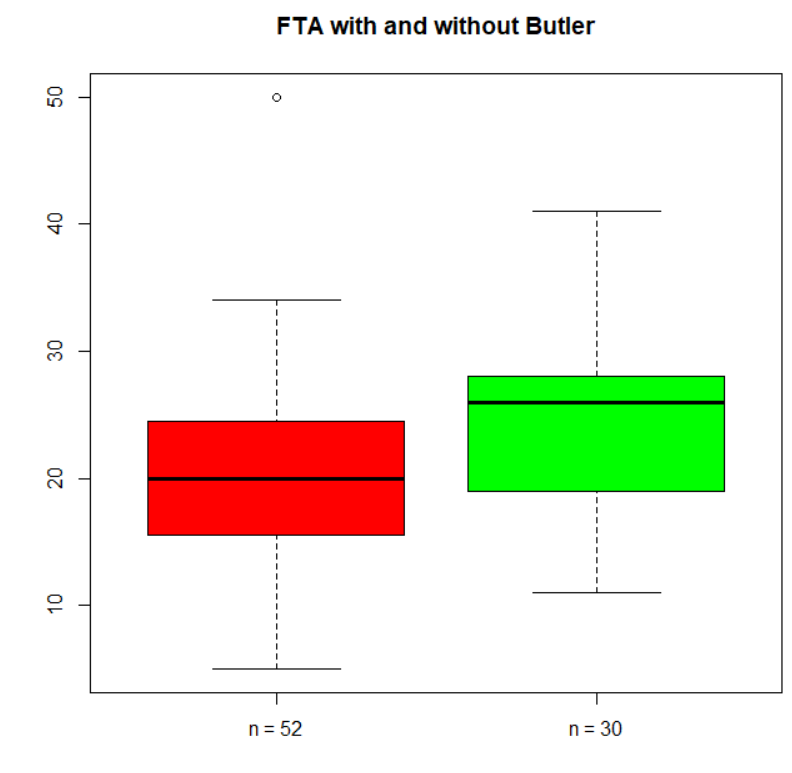
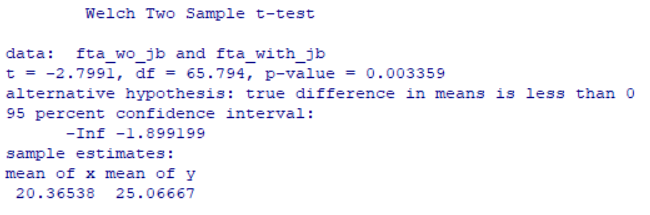
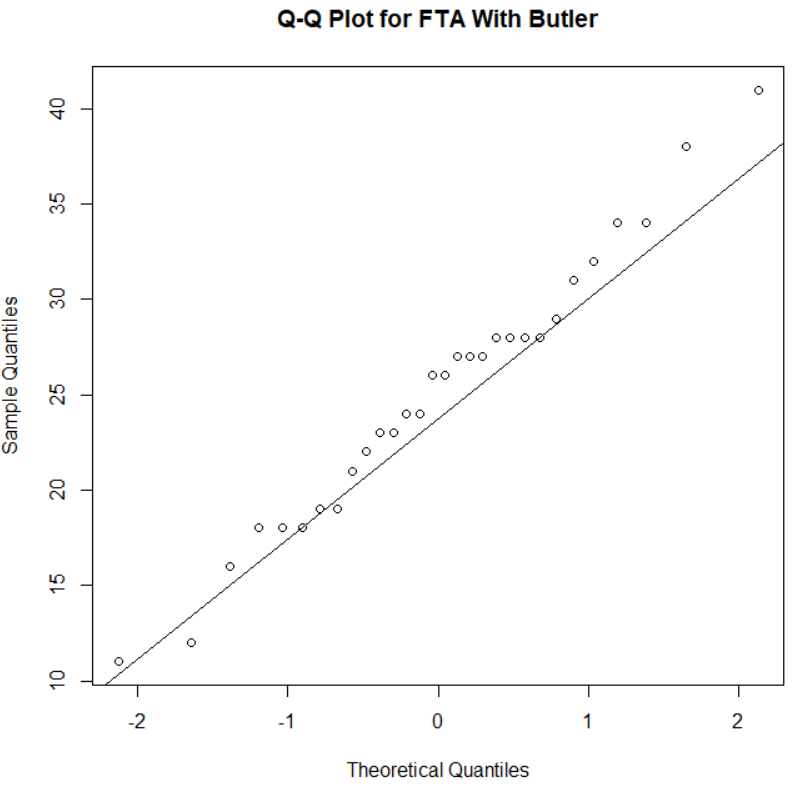
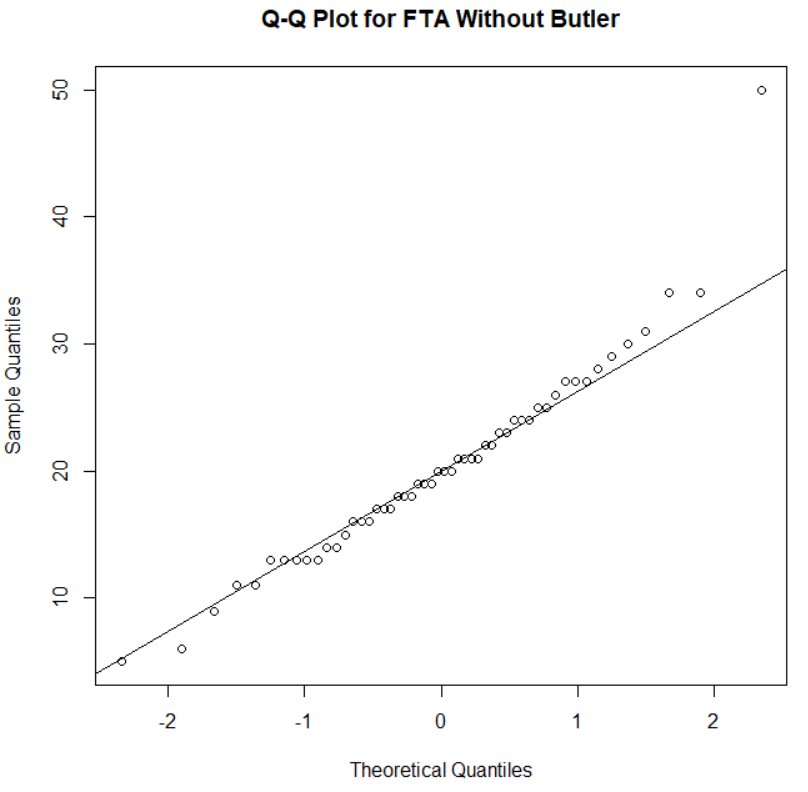
Using an unpaired t-test is the best way to determine if these two averages are different, as it most accurately compares the two averages to determine if there is a difference between the two. The t-test is also a valid way to use this data, as both
datasets have a size greater than 30, and their Q-Q plots look fairly-normally distributed (Appendix C) except for one extreme value of 50 FTA attempted in a game against the Houston Rockets before Butler joined the team. However, removing this value would only make our p-value even more significant.
As for our conclusion, a p-value of 0.003359 is extremely significant, showing that if the two average FTA were the same, there would only be a 0.3359% chance that we would get an average that much greater. This allows us to reject the null hypothesis that there is no difference in the average FTA with and without Butler. Thus, we can conclude that Jimmy Butler’s presence on the team did help to increase the amount of FTA per game for the Golden State Warriors.
"Makes the Game Easier for Others as a PLAYMAKER"
While Jimmy Butler likes to attack the basket, he also knows when to pass the ball to his teammates to give them a better opportunity to score [11]. Before Butler joined the team, Draymond Green was considered the main ball handler, taking the ball up the court more than anyone else. However, Jimmy Butler is also extremely good at handling the ball. This allows teammates to get the ball in a better position, therefore making their shots easier.
The best way to determine if Butler’s playmaking translated to the Warriors is by comparing the FG% of players before and after Butler joined. Field goal percentage is the percentage of a player's total shots that went into the basket. We will be following the same steps as we did for our FTA.
H_0 - the average FG% when Butler plays and doesn’t play is equal
H_A - the average FG% when Butler plays is greater than we he does not play
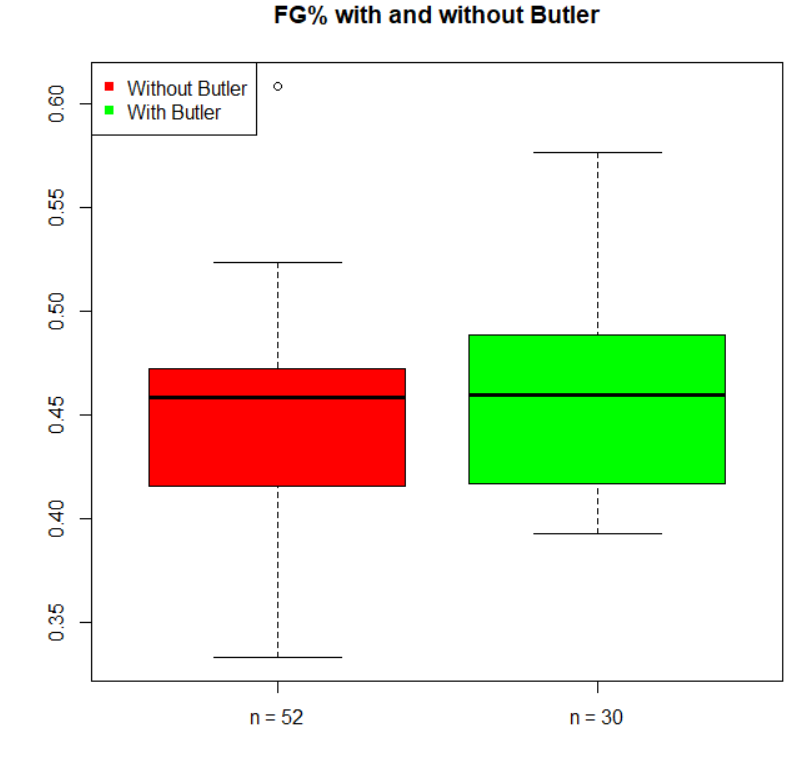
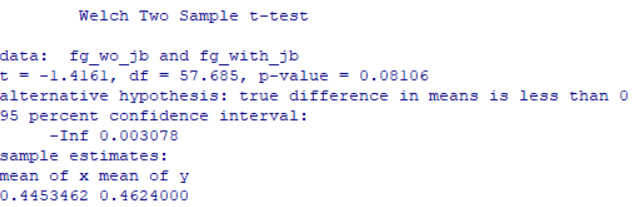
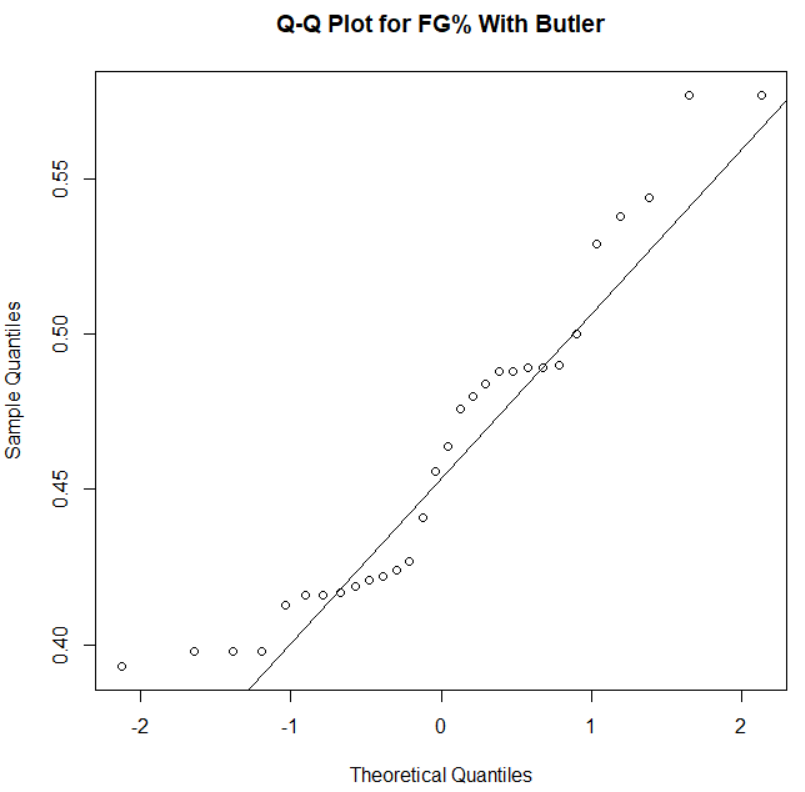
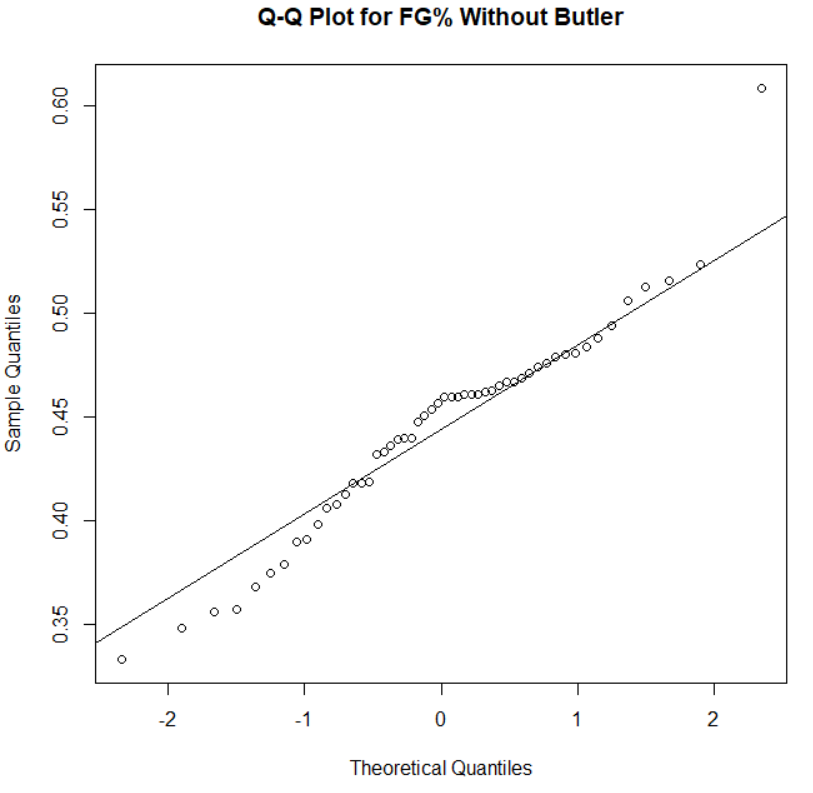
With a p value of 0.08106, there is still a chance that average FG% before and after Butler joined the team are the same, and we cannot reject the null hypothesis. This value might not be significant enough because the Warriors already had Draymond Green as a primary ballhandler, so Butler’s impact might be smaller because Green still is the main player moving up the floor with the ball every possession. However, with a 8.106% chance that this change in average exists, we can still see a small significance between Butler joining the team and the increase in FG%. On top of this, our Q-Q plot for our FG% is less normal than for our FTA (Appendix C), which could make our results less strong.
"Defends at a High Level"
Another one of Butler’s strengths is his defense. Throughout his long career in the NBA, he is often considered an above average defender because of his tenacity and focus [11]. While Butler is an extremely good defender, there are also multiple other players on the Warriors who missed parts of the 2024-2025 season, which could skew the data. Specifically, Jonathan Kuminga, who is also considered an above average defender, missed around half the season because of knee injury [12][13]. Kuminga came back around halfway between when Jimmy Butler joined the team and the end of the season. A simple t-test looking at the difference between opposing team’s points scored when Butler did and did not play could properly show how Jimmy Butler impacted the defense, but running an ANOVA test with the categories being Jimmy Butler and Johnathan Kuminga’s availability could give a better picture on if Jimmy Butler impacted the defense even when considering Kuminga’s injury.
H_0 - the average number of points scored on the Golden State Warriors is the same when neither Kuminga or Butler plays, when just Butler plays, when just Kuminga plays, and when both Butler and Kuminga play.
H_A - at least one of the average number of points scored on the Golden State Warriors is different depending on the availability of Johnathan Kuminga and Jimmy Butler.
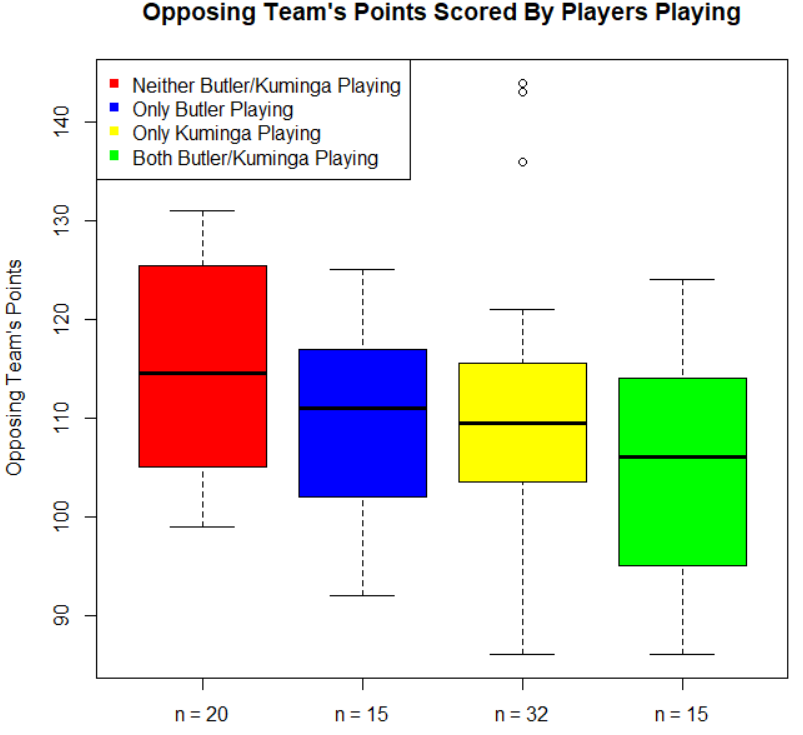
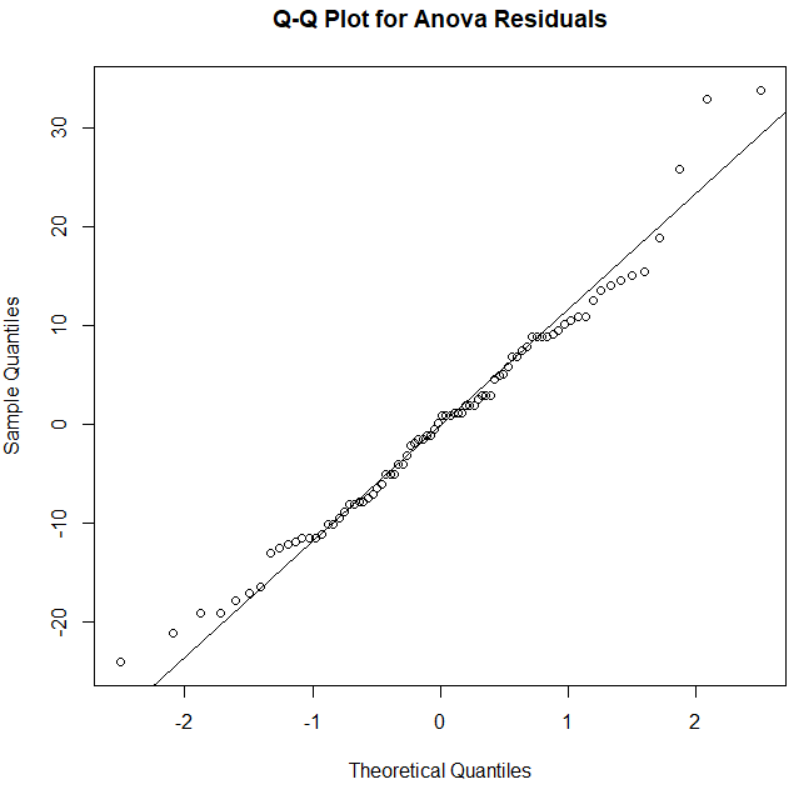
As for our assumptions with the ANOVA model, our variability (Appendix C) between most of our groups are relatively similar, with some major outliers in our group of just Johnathan Kuminga games. These come from games where the Warriors got 144, 143, and 136 points scored on them in games from November and December. Our residual Q-Q plot for our ANOVA table is also fairly linear (Appendix C) except from some large outliers on the ends. However, because most of the variability is similar and the Q-Q plot is relatively similar, we can use the ANOVA test.

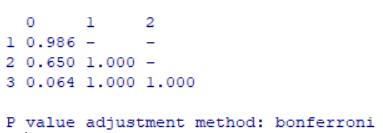
With a p-value of 0.0809, we have a fairly strong significance that there are some mean points allowed that are different from the others. While it is not the usual alpha of 0.05 to confirm significance, we could possibly contribute it to the three extreme outliers mentioned previously. Running a paired t-test with the Bonferroni method on our categories, there seems to be a significant difference (0.064) between having neither Johnathan Kuminga and Jimmy Butler and having both of them playing. This does diminish the original thought that Jimmy Butler is a superior defender on his own but highlights how the additions of both Jimmy Butler and Johnathan Kuminga coming back from injury together impacted the Warriors defense.
"Butler’s Offense"
The three skills that we have highlighted so far with Jimmy Butler showcase how he can create tangible results with his intangible skills. Oftentimes, the easiest statistics to understand, such as points and assists, do not highlight the overall impact a player has for their team, nor are the main strengths that a player possesses. I wanted to see if this was true for Butler. More specifically, I want to see if Butler scoring more points, assists, or rebounds in a specific game correlates to the team scoring more total points in the game. The results of this test could help show what tangible parts of Butler’s individual performance actually contribute to a better offensive performance, or if his main strength is not in his box score. The best way to test this would be to set up a multiple linear regression model, with Butler’s points, assists, and rebounds as the variables trying to predict the total points scored by the Warriors in that game.
H_0 - all of the slopes of Butler’s points, rebounds, or assists are 0 in determining the number of points scored by the Warriors
H_1 - at least one of the slopes for Butler’s points, rebounds, or assists is not 0
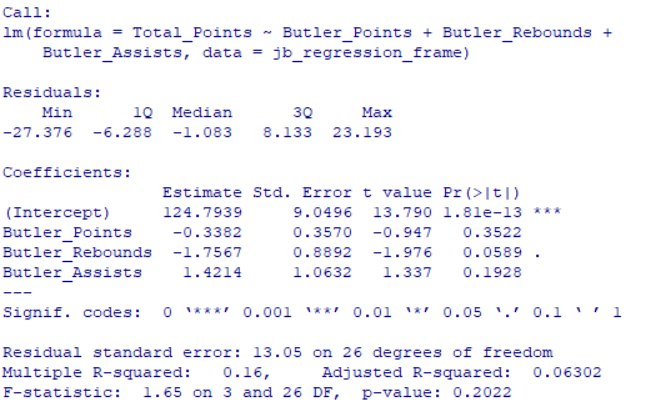
As we can see, with a partial F-test result of p = 0.2022, we cannot determine that any of the slopes are not zero, and we cannot reject our null hypothesis. Paired with an extremely small R-squared value of 0.16, this shows that Butler’s tangible results in Butler’s game do not actively predict the team’s overall offensive ability. This matches Butler’s description as a player that does more than contribute to the team’s points, rebounds, and assists. Rather, Butler is a player that contributes in less obvious ways like his ability to play make, defend, and get to the free throw line.
Summary
As with every NBA Superstar, Jimmy Butler has many strengths that make him an excellent player. Our analysis has shown that he can change an entire team’s statistics with just his ability to get fouled, play defense, and pass the ball. The way that Butler morphs a team is harder to see that just through the numbers next to his name after it has finished. His ability has shown that he can create a winning basketball team without scoring points, getting rebounds, or making assists. Butler joined the Warriors after a frustrating start to the season in Miami, and both him and the Warriors benefitted from it. The Warriors would then go on to make the playoffs as the 7th seed, where they would have an upset victory over the 2nd seeded Rockets before they were eliminated in the quarterfinals to the Timberwolves [14]. While Butler and the Warriors did not end up the strongest team in the NBA, their union showed how one player can create a significantly large impact on any NBA team.
appendix a:
Q-Norm Graphs for FTA:
Q-Norm Graphs for FG%:
Variability/Q-Norm Graphs for Opponent’s Points Scored: 0 - Neither Kuminga or Butler, 1 - Just Butler, 2 - Just Kuminga, 3 - Both Kuminga and Butler

references:
[1] Campbell, Joey. “The 12 Best Basketball Leagues in the World.” Sleeper Fantasy Guides, 27 Feb. 2025, sleeper.com/blog/best-basketball-leagues-world/.
[2] “How Many Players Are on an NBA Roster?” PFSN, 29 May 2025, www.profootballnetwork.com/nba/how-many-players-are-on-an-nba-roster/.
[3] Johnson, J. (2020, June 25). NBA: Which Player Is Best At Each Major Skill? . USA Betting. https://www.usabetting.com/nba-skill/
[4] From. (2025, February 6). Reports: Jimmy Butler joins Warriors in multi-team deal with Heat. Nba.com; NBA.com. https://www.nba.com/news/jimmy-butler-heading-to-warriors-in-multi-player-deal-with-heat
[5] Champion, K. (2024). Jimmy Butler’s Seamless Fit With Warriors and Rejuvenating Impact of His Star Power. @Warriors. https://doi.org/10612744/2022/06/gsw-logo-1920
[6] The Golden State Warriors 2024-2025 Team Game Log from Basketball Reference: 2024-25 Golden State Warriors Team Game Log | Basketball-Reference.com
[7] Jimmy Butler’s 2024-2025 Game Log from Basketball Reference: Jimmy Butler 2024-25 Game Log | Basketball-Reference.com
[8] A report of NBA averages across the 2020-2021 season: Data Analysis of Impact of Each NBA Position
[9] The NBA Season Summary from Basketball Reference: 2024-25 NBA Season Summary | Basketball-Reference.com
[10] Mendelowitz, B. (2025, March 5). NBA Team Heights: Average Height of Every Roster in 2024-25. VegasInsider. https://www.vegasinsider.com/nba/average-height-of-nba-teams/
[11] Medina, M. (2025, October 23). Why Jimmy Butler Makes Warriors a Title Contender Again. Athlon Sports. https://athlonsports.com/nba/golden-state-warriors/why-jimmy-butler-makes-warriors-title-contender-again
[12] Taylor, A. (2025). Warriors’ Steve Kerr provides new update on Jonathan Kuminga’s injury. Warriors Wire. https://warriorswire.usatoday.com/story/sports/nba/warriors/2025/11/25/steve-kerr-provides-new-update-on-jonathan-kumingas-injury/87471528007/
[13] Jonathan Kuminga’s 2024-2025 Game Log: Jonathan Kuminga 2024-25 Game Log | Basketball-Reference.com
[14] Official release. (2025, March 30). 2025 NBA Play-in, Playoffs & Finals Schedule. NBA; NBA.com. https://www.nba.com/news/2025-nba-playoffs-schedule
R code
# You need to download the package "rvest" to be able to get the tables straight from the
# internet
library(rvest)

# This is for the Jimmy Butler Basketball Reference Table
url <- "https://www.basketball-reference.com/players/b/butleji01/gamelog/2025#player_game_log_reg"
page <- read_html(url)

tables <- html_table(html_nodes(page, "table"), fill = TRUE)

# Select the eighth table, as the first seven are not the main tables
jb_table <- tables[[8]]

# The table has extra lines that are repeats of the column headers, this line deletes those extra lines
test_table = jb_table[jb_table[[2]] != "Gcar", ]

# extra function I created to prepare all the jimmy butler data, removing all the lines
# that are not games Butler played in
prepare_data <- function(x) {
	x = x[x != "Did Not Dress"]
	x = x[x != "Not With Team"]
	x = x[x != "Did Not Play"]
	x = x[x != "Inactive"]
	x = head(x, -1)
	x = as.numeric(x)
	return(x)
}

# gets seperate lines for each of Butler's points, assists, rebounds, blocks, and steals
jb_points = test_table$PTS
jb_points = prepare_data(jb_points)
jb_assists = test_table$AST
jb_assists = prepare_data(jb_assists)
jb_rebounds = test_table$TRB
jb_rebounds = prepare_data(jb_rebounds)
jb_blocks = test_table$BLK
jb_blocks = prepare_data(jb_blocks)
jb_steals = test_table$STL
jb_steals = prepare_data(jb_steals)

# boxplot that shows Butler's boxscore stats
boxplot(jb_points, jb_rebounds, jb_assists, jb_blocks,
jb_steals, names=c("Points", "Rebounds", "Assists", "Blocks", "Steals"),
col = 3, main = "Jimmy Butler's Tangible Numbers")

# the NBA means for every catergory (as from reference 8 in the PDF)
group_means = c(8.62, 3.58, 1.94, 0.42, 0.61)

# lines that refer to the average for each catergory
segments(x0=1:length(group_means)-0.5,
y0=group_means, x1=1:length(group_means)+0.5,
y1=group_means, col="red", lwd=5)

# input for the Golden State Warriors table
url <- "https://www.basketball-reference.com/teams/GSW/2025/gamelog/#team_game_log_reg"
page <- read_html(url)

# The table is split into four tables, we are only going to use the score, Warrriors, and oposing team tables
# to do this, we split it into three different tables
tables <- html_table(html_nodes(page, "table"), fill = TRUE)
warriors_table = tables[[1]]
warriors_table
warriors_scores = warriors_table[, 6:9]
warriors_team = warriors_table[, 10:30]
warriors_away_team = warriors_table[, 31:51]

# warriors tables also have extra column name lines, as well
# as the first column lines being part of row 1
colnames(warriors_scores) = warriors_scores[1, ]
warriors_scores = warriors_scores[-1, ]
warriors_scores = warriors_scores[warriors_scores$Rslt != "Rslt", ]
warriors_scores = head(warriors_scores, -1)

# does the same thing for the team stats as for the scores stats
colnames(warriors_team) = warriors_team[1, ]
warriors_team = warriors_team[-1, ]
warriors_team = warriors_team[warriors_team$FG != "FG", ]
warriors_team = head(warriors_team, -1)
warriors_team

# arrays for basic Warrior statistics
w_points = warriors_scores$Tm
w_allowed = warriors_scores$Opp
w_assists = warriors_team$AST
w_rebounds = warriors_team$TRB
w_blocks = warriors_team$BLK
w_steals = warriors_team$STL

# all stats are strings and need to be converted
w_points = as.numeric(w_points)
w_allowed = as.numeric(w_allowed)
w_assists = as.numeric(w_assists)
w_rebounds = as.numeric(w_rebounds)
w_blocks = as.numeric(w_blocks)
w_steals = as.numeric(w_steals)

# boxplot of basic Warriors points scored and allowed
boxplot(w_points, w_allowed,
names=c("Points Scored", "Points Allowed"),
col = c("blue","yellow"), main = "Warriors Points Scored/Allowed")

# average NBA team points scored and allowed as from reference
# 9 in the PDF are added as lines for reference
group_means = c(113.8, 113.8)
segments(x0=1:length(group_means)-0.5,
y0=group_means, x1=1:length(group_means)+0.5,
y1=group_means, col="red", lwd=5)

# boxplot of Warriors average rebounds, assists, blocks, and steals
boxplot(w_rebounds, w_assists, w_blocks, w_steals,
names=c("Rebounds", "Assists", "Blocks", "Steals"),
col = c("blue", "yellow", "blue", "yellow"), main = "Warriors
Other Results")

# average NBA team rebounds, assists, blocks, and steals as from reference
# 9 in the PDF are added as lines for reference
group_means = c(44.1, 26.5, 8.2, 4.9)
segments(x0=1:length(group_means)-0.5,
y0=group_means, x1=1:length(group_means)+0.5,
y1=group_means, col="red", lwd=5)


# Jimmmy Butler played games 52-59 and games 61-82 for the Warriors
jb_played = rep(0, 82)
jb_played[52:59] = 1
jb_played[61:82] = 1

# Add Butler's games played for the warriors as a column
warriors_scores$jb_played = jb_played

# get a number for how many games the Warriors won/lost with/without Jimmy Butler
won_with_jb = sum(warriors_scores$Rslt == 'W' & warriors_scores$jb_played == 1)
lost_with_jb = sum(warriors_scores$Rslt == 'L' & warriors_scores$jb_played == 1)
won_wo_jb = sum(warriors_scores$Rslt == 'W' & warriors_scores$jb_played == 0)
lost_wo_jb = sum(warriors_scores$Rslt == 'L' & warriors_scores$jb_played == 0)

# find win percentages with/without Butler and graph them in a barplot
percentages = c(won_wo_jb / (won_wo_jb + lost_wo_jb), won_with_jb / (won_with_jb + lost_with_jb))
barplot(percentages,
	ylab = "Win %",
	main = "Winning Percentages With and Without Butler",
	col = c("red", "green"),
	ylim = c(0, 1),
	names.arg = c("n = 52", "n = 30")
	)
legend("topleft",                # position ("topright", "bottomleft", etc.)
       legend=c("Without Butler", "With Butler"),  # labels
       col=c("red", "green"),     # colors used in plot
       pch = 15)

# A basic proportion test to see if Butler being on the team significantly
# affects the team
prop.test(x = c(won_wo_jb, won_with_jb), n = c(won_wo_jb + lost_wo_jb, won_with_jb + lost_with_jb),
alternative = "less")

# Getting arrays of FTA with/without Butler
warriors_team$jb_played = jb_played
fta_with_jb = warriors_team$FTA[warriors_team$jb_played == 1]
fta_wo_jb = warriors_team$FTA[warriors_team$jb_played == 0]

# FTA are stored as strings in the original tables
fta_with_jb = as.numeric(fta_with_jb)
fta_wo_jb = as.numeric(fta_wo_jb)

# t-test to see if there is a significant difference in the average
# FTA before and with Butler
t.test(fta_wo_jb, fta_with_jb, alternative = 'less')

# boxplot of FTA before and with Butler
boxplot(fta_wo_jb, fta_with_jb, col = c("red", "green"),
	main = "FTA with and without Butler",
	names = c("n = 52", "n = 30")
)
legend("topleft",                # position ("topright", "bottomleft", etc.)
       legend=c("Without Butler", "With Butler"),  # labels
       col=c("red", "green"),     # colors used in plot
       pch = 15)

# Q-Q lines to try and prove normal distribution
qqnorm(fta_wo_jb, main = "Q-Q Plot for FTA Without Butler")
qqline(fta_wo_jb, col = "black")
qqnorm(fta_with_jb, main = "Q-Q Plot for FTA With Butler")
qqline(fta_with_jb, col = "black")

# Repeat process for FTA with FG%
fg_with_jb = warriors_team$'FG%'[warriors_team$jb_played == 1]
fg_wo_jb = warriors_team$'FG%'[warriors_team$jb_played == 0]
fg_with_jb = as.numeric(fg_with_jb)
fg_wo_jb = as.numeric(fg_wo_jb)

t.test(fg_wo_jb, fg_with_jb, alternative = 'less')
boxplot(fg_wo_jb, fg_with_jb, col = c("red", "green"),
	main = "FG% with and without Butler",
	names = c("n = 52", "n = 30")
)
legend("topleft",                # position ("topright", "bottomleft", etc.)
       legend=c("Without Butler", "With Butler"),  # labels
       col=c("red", "green"),     # colors used in plot
       pch = 15)

qqnorm(fg_wo_jb, main = "Q-Q Plot for FG% Without Butler")
qqline(fg_wo_jb, col = "black")
qqnorm(fg_with_jb, main = "Q-Q Plot for FG% With Butler")
qqline(fg_with_jb, col = "black")

# array with 2 if Kuminga played and 0 if he did not
jk_played = rep(0, 82)
jk_played[0:15] = 2
jk_played[18:34] = 2
jk_played[66:74] = 2
jk_played[76:81] = 2

# add Kuminga played stat to Warriors Table
warriors_team$jk_played = jk_played

# created 'played_cat' column, with 0 being neither Butler or Kuminga
# 1 Being just Butler, 2 Being just Kuminga, and 3 being both
# done by adding together the jb_played and jk_played numbers
warriors_team$played_cat = warriors_team$jb_played + warriors_team$jk_played
warriors_scores$played_cat = warriors_team$played_cat
warriors_away_team$played_cat = warriors_team$played_cat

# ANOVA table with the played_cat list as factors
defense_aov = aov(as.numeric(warriors_scores$Opp)~as.factor(warriors_scores$played_cat))
summary(defense_aov)

#boxplot of the anova table catergoies
boxplot(as.numeric(warriors_scores$Opp)~as.factor(warriors_scores$played_cat),
main = "Opposing Team's Points Scored By Players Playing",
col=c("red", "blue", "yellow", "green"),
names = c("n = 20", "n = 15", "n = 32", "n = 15"),
ylab = "Opposing Team's Points")

legend("topleft",                # position ("topright", "bottomleft", etc.)
       legend=c("Neither Butler/Kuminga Playing", "Only Butler Playing", "Only Kuminga Playing",
	"Both Butler/Kuminga Playing"),  # labels
       col=c("red", "blue", "yellow", "green"),     # colors used in plot
       pch = 15)

# length of each catergory in the table used to create the
# legend above
table(warriors_scores$played_cat)

# pairwise t test with bonferroni p-value adjustment
pairwise.t.test(x=as.numeric(warriors_scores$Opp), g=as.factor(warriors_scores$played_cat)
,p.adj="bonferroni")

# gives the variance of each category
tapply(as.numeric(warriors_scores$Opp), as.factor(warriors_scores$played_cat), var)

# Q-Q graph of the residuals in the ANOVA
qqnorm(residuals(defense_aov), main = "Q-Q Plot for Anova Residuals")
qqline(residuals(defense_aov), col="black")

# Array used for the regression line of the total points the warriors scored
# When Jimmy Butler was playing
warriors_points = warriors_scores$Tm
warriors_points_with_jb = warriors_scores$Tm[warriors_scores$jb_played == 1]

# Regression Line dataframe with total points scored, and then Butler's
# points, assists, and rebounds in those games
jb_regression_frame <- data.frame(
  Total_Points = warriors_scores$Tm[warriors_scores$jb_played == 1],
  Butler_Points = jb_points[26:55],
  Butler_Assists = jb_assists[26:55],
  Butler_Rebounds = jb_rebounds[26:55]
)

# Creating the multi-variable linear regression model
model = lm(Total_Points~Butler_Points+Butler_Assists+Butler_Rebounds, data = jb_regression_frame)

# summary of the regression model
summary(model)